Harnessing Chat-Driven Data Analytics and Business Intelligence: Revolutionizing Insights
In the realm of data analytics and business intelligence (BI), chat-driven platforms have emerged as powerful tools that are transforming the way organizations derive insights from their data. This innovative approach combines the ease of communication through chat interfaces with the analytical capabilities needed for informed decision-making. Let's delve into the world of chat-driven data analytics and BI strategy, exploring popular tools like Evidence, Hex, Rill, Malloy, zing, Embeddable,Holistics, Lightdash and others that are driving this digital revolution.
BI-as-code ?
Before diving into the different tools, it's important to understand why such tools are emerging. Data engineering has seen significant advancements, yet the rest of the analytics chain often hasn't kept pace.
Typically, business and analytics users extract data from a data warehouse and build their dashboards using WYSIWYG tools such as Tableau, PowerBi, or Excel.
What's the issue with these tools?
They were designed with a user interface-first focus to lower the technical barrier to entry. However, this approach can lead to increased technical debt.
For instance, how do you roll back a UI dashboard or prevent it from breaking? Ultimately, the dashboard that presents your Key Performance Indicators (KPIs) is a software asset. Let's consider what some tools offer today, along with their advantages (remember, the choice is yours). They all share some common features:
- Open-source nature
- Paid or managed services for hosting
- BI as a code approach, allowing for versioning and testing through standard CI pipelines
Evidence : SQL + Markdown
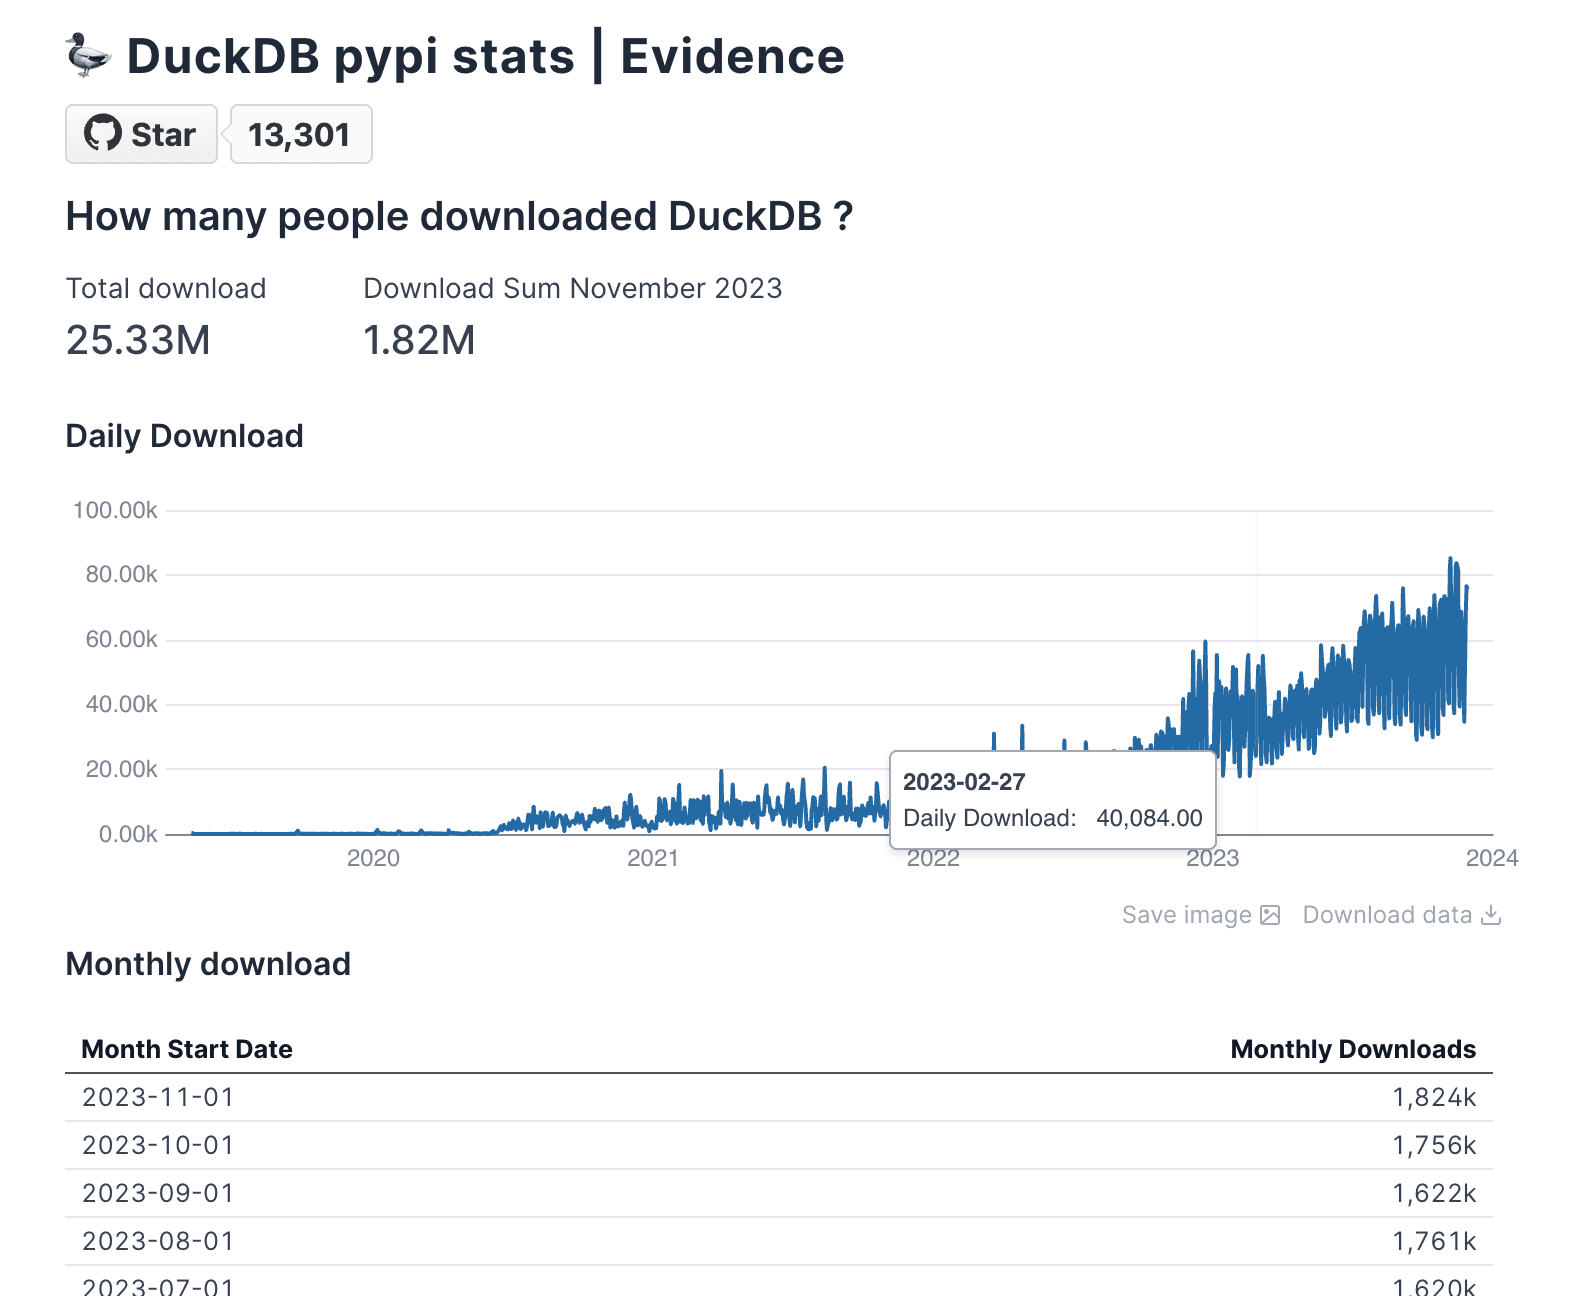
Evidence is a lightweight JS framework designed for building data apps using Markdown and SQL. You simply construct your dashboard using existing components, incorporate them using SQL within your markdown, and you're set! The end product is a static website that can be hosted anywhere: Vercel, Netlify, or Evidence Cloud.

Rill : SQL + YAML
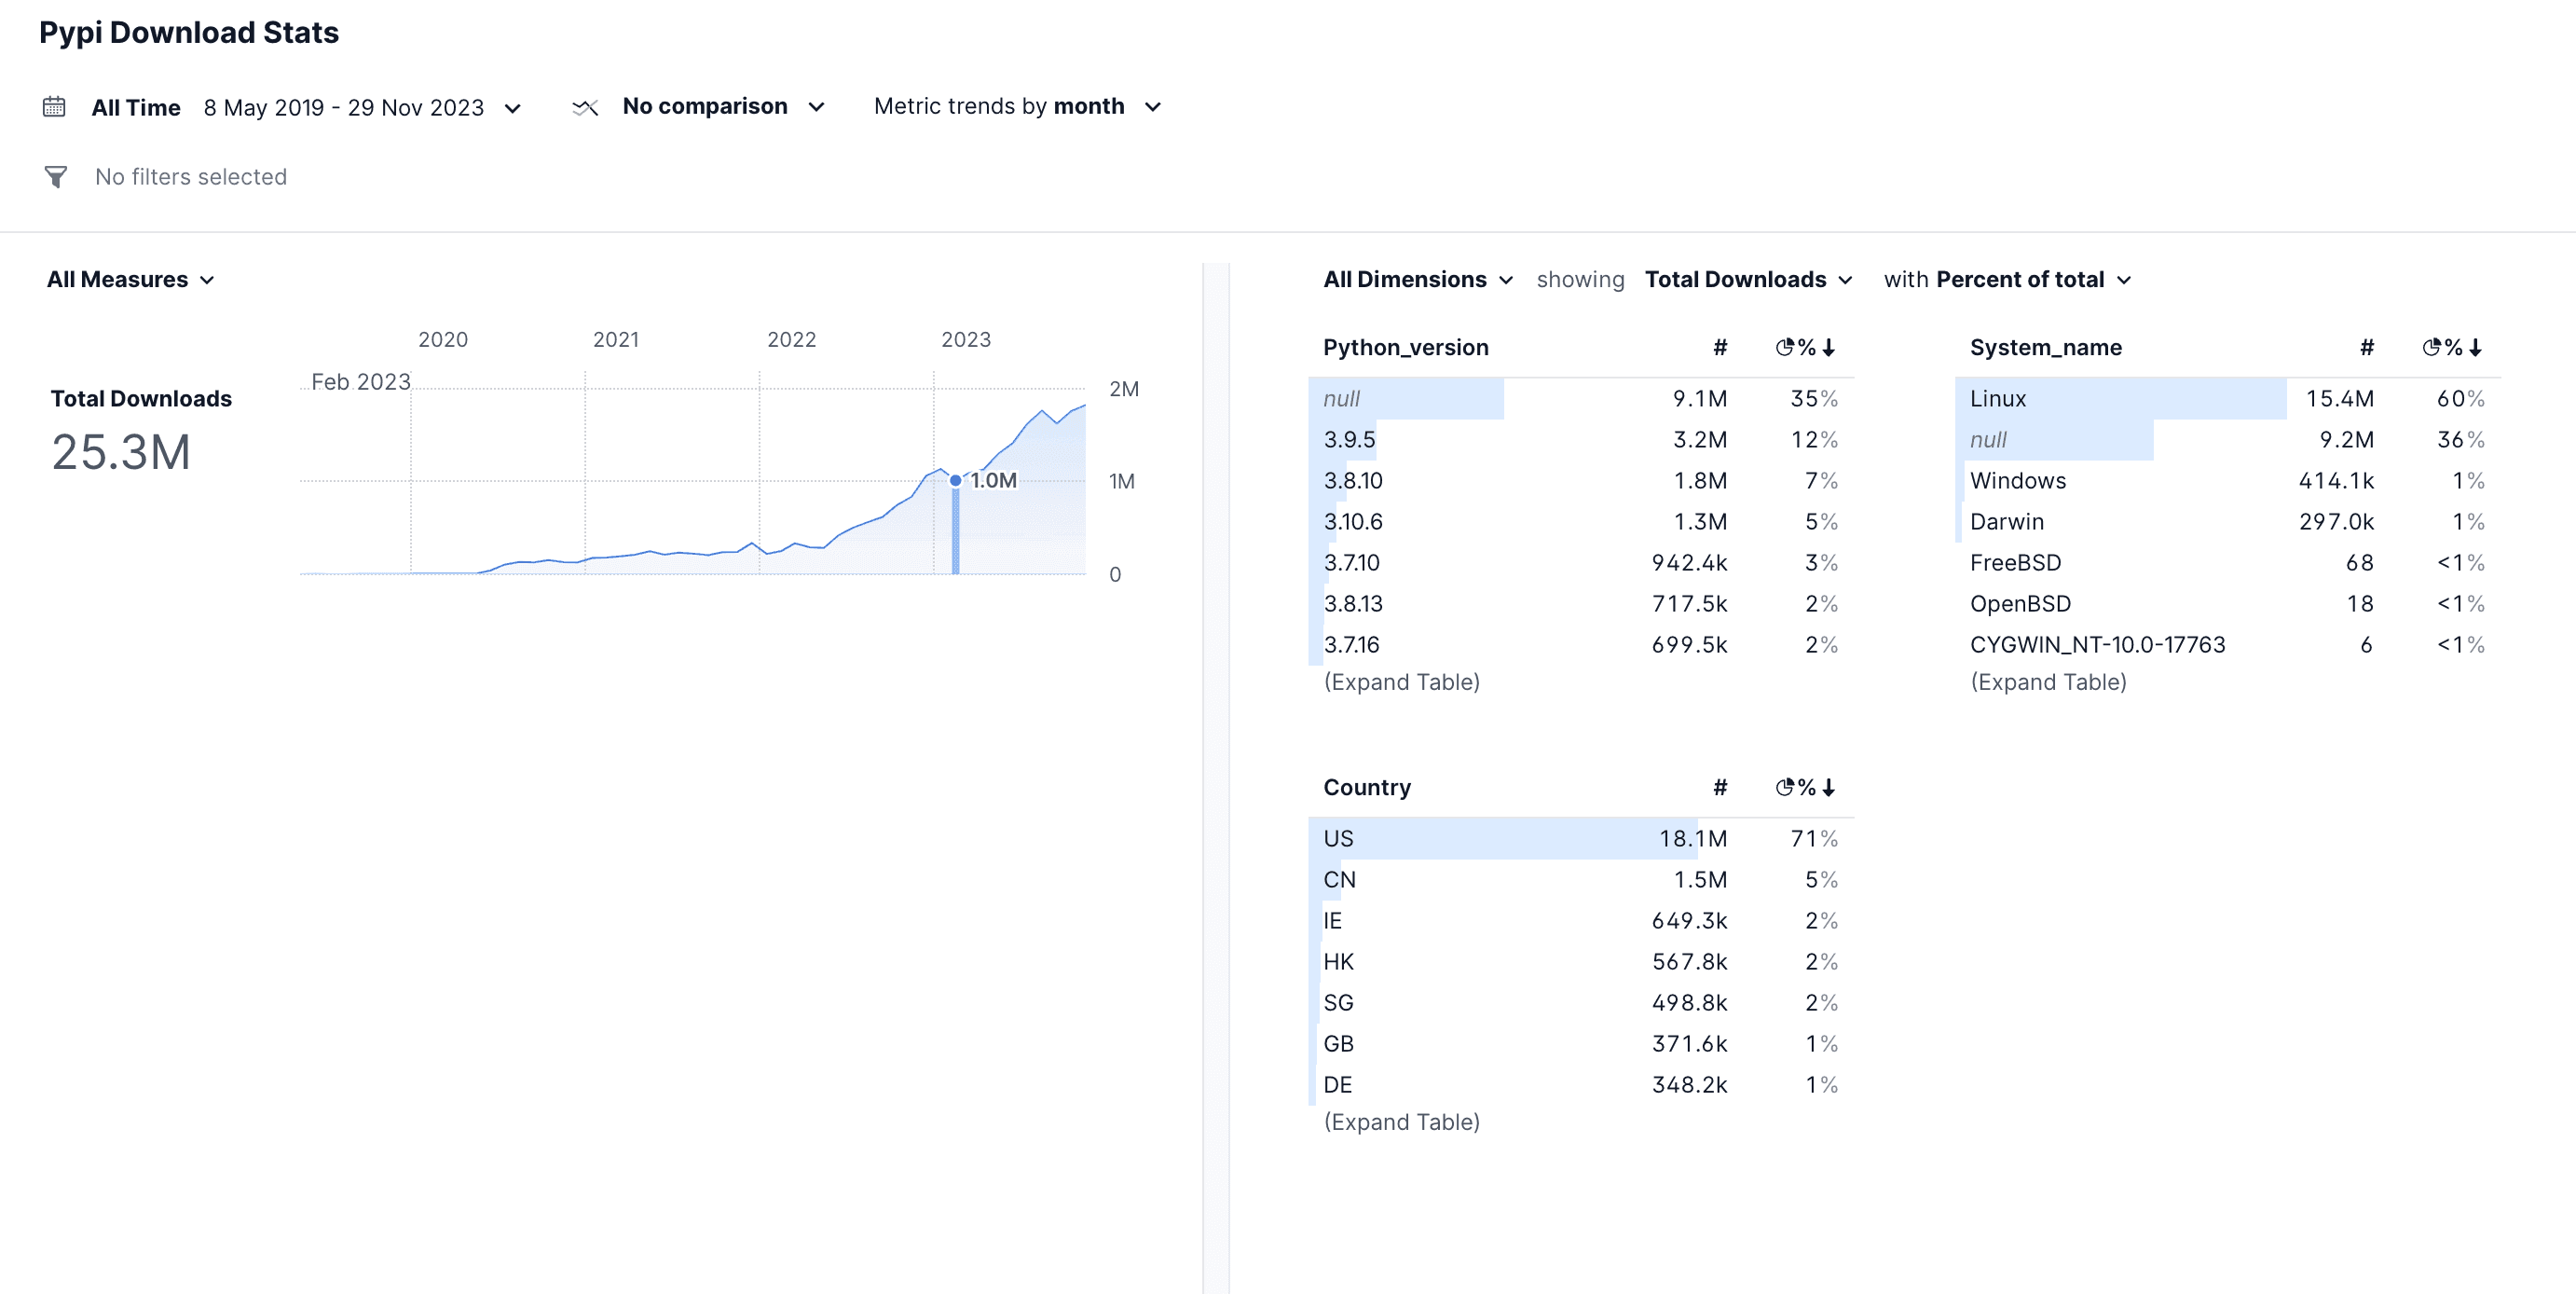
Rill, by Rilldata, allows you to create dashboards using only SQL and YAML files. They offer a convenient CLI for running it locally, using a local web UI to draft queries/dashboards, or for deploying on their Cloud. Here's a fun fact: Rill is built using DuckDB.

Malloy
Malloy is an experimental language for describing data relationships and transformations. It is an analytical language that runs on SQL databases. It provides the ability to define a semantic data model and query it. Malloy currently works with SQL databases BigQuery, Postgres, and querying Parquet and CSV via DuckDB.
- Queries compile to SQL, optimized for your database.
- Has both a semantic data model and a query language. The semantic model contains reusable calculations and definitions, making queries short and readable.
- Excels at reading and writing nested data sets.
- Things that are complicated in SQL are simple to express in Malloy. For example: level of detail calculations, percent of total, aggregating against multiple tables across a join safely, date operations, reasonable ordering by default, and more.

Hex data
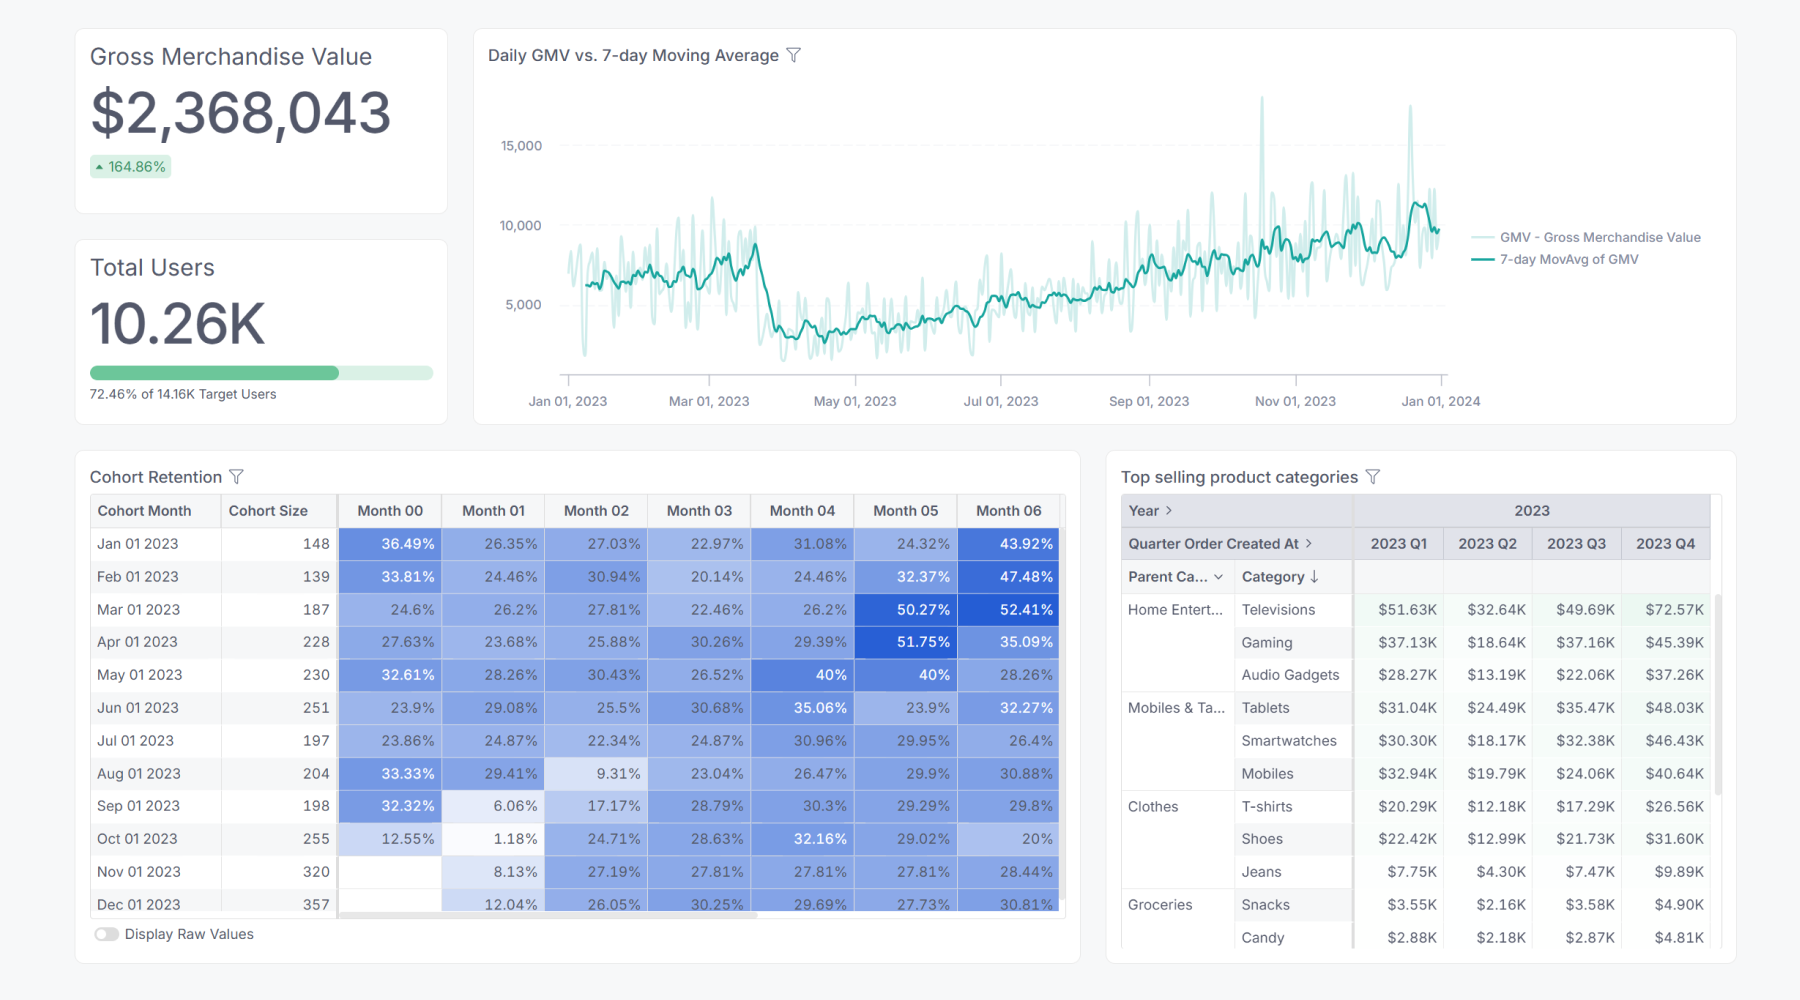
Hex makes it easy to turn SQL queries into beautiful production dashboards. With a more powerful SQL workspace than other BI tools, as well as a more flexible report builder, you can build any dashboard other tools can— and more.
Holistics
Holistics offers both experiences in the same platform: a SQL-friendly, maintainable interface for data analysts & a reliable self-service experience for non-technical users.

Streamlit : Python
Streamlit has been in the market for a few years and was acquired by Snowflake in Q1 2022. The primary advantage (and possibly disadvantage) of Streamlit is that it allows you to stay within your Python data workflow and use the same ecosystem to develop your data apps. Hence, you build your data apps with Python and need a Python runtime for hosting.
Empowering Conversations with Data Insights:
Chat-driven data analytics platforms offer a user-friendly interface where stakeholders can interact with data in a conversational manner. By leveraging natural language processing and machine learning algorithms, these tools enable users to query, analyze, and visualize data seamlessly through chat conversations. This intuitive approach democratizes data access within organizations, allowing users across departments to derive actionable insights without requiring specialized technical skills.
Leading Chat-Driven BI Tools:
Evidence.dev: Known for its intuitive chat interface and robust analytical capabilities, Evidence.dev empowers users to explore complex datasets, generate reports, and collaborate on insights effortlessly.
Hex: Hex stands out for its comprehensive AI-driven analytics engine that enables users to ask questions, receive instant answers, and uncover hidden patterns within data through simple chat interactions.
Malloydata: Malloydata's chat-driven BI platform excels in providing real-time insights, predictive analytics, and personalized recommendations through its conversational interface, enhancing decision-making processes.
The Rise of BI as Code:
In the realm of data analytics, BI as code has gained traction as a more agile and scalable alternative to traditional BI tools. Unlike conventional BI solutions that rely on predefined report templates and dashboards, BI as code enables analysts and data scientists to write code scripts that automate data analysis, visualization, and reporting processes. This code-centric approach offers greater flexibility, customization, and reproducibility in data analytics workflows, empowering organizations to adapt quickly to changing business requirements and evolving data landscapes.
Advantages of BI as Code Over Traditional BI Tools:
Flexibility: BI as code allows for dynamic customization of analyses, visualizations, and reporting structures based on specific business needs, driving greater flexibility in data exploration and insights generation.
Scalability: With BI as code, organizations can scale analytics processes efficiently by automating repetitive tasks and integrating advanced analytics models seamlessly, leading to improved operational efficiency and resource utilization.
Reproducibility: By encapsulating data analysis workflows within code scripts, BI as code enhances the reproducibility and transparency of analytical processes, enabling stakeholders to validate results and trace data transformations more effectively.
Relevant Statistics and Perspectives:
According to a report by Gartner, by 2023, 40% of data science tasks will be automated through the use of AI and machine learning algorithms, transforming the traditional BI landscape significantly. Source
A survey by Harvard Business Review Analytics Services found that organizations leveraging chat-driven BI tools reported a 13% increase in decision-making speed and a 15% improvement in decision quality. Source
In conclusion, the convergence of chat-driven data analytics platforms and BI as code represents a paradigm shift in how organizations extract value from their data assets. By embracing these innovative approaches, businesses can drive data-driven decision-making, enhance operational efficiency, and gain a competitive edge in today's data-centric landscape.
Sources:

 By Applerlabs
 1.5k
1.5k 86
86


